

Dashboards- Report Settings
What customization options are available on the dashboard?
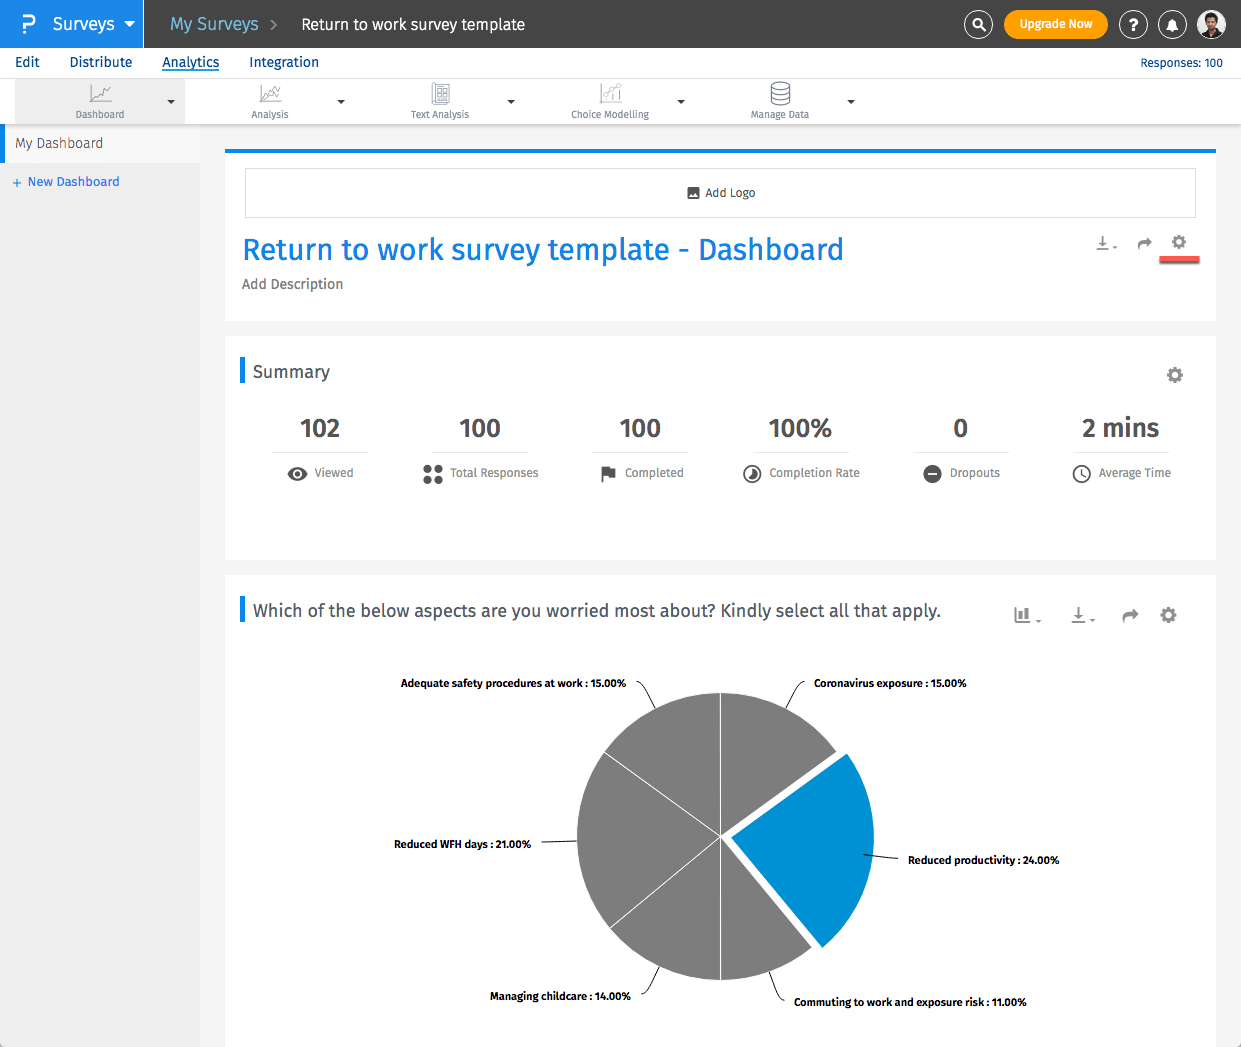
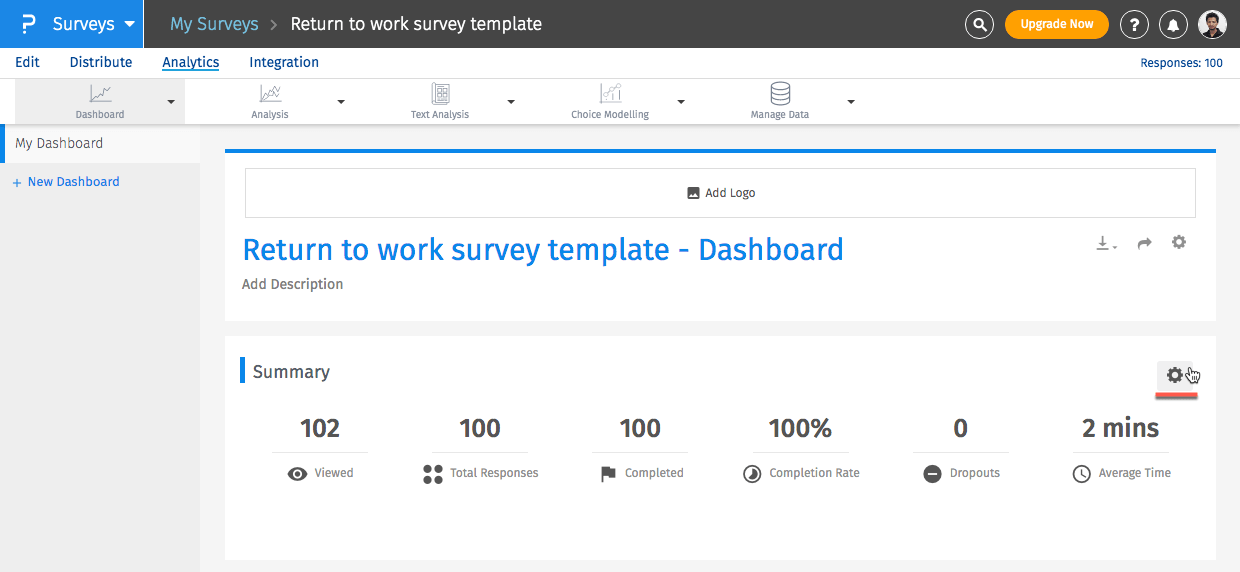
You can click on the gear icon to access the report Settings
Following settings are available for the dashboard:
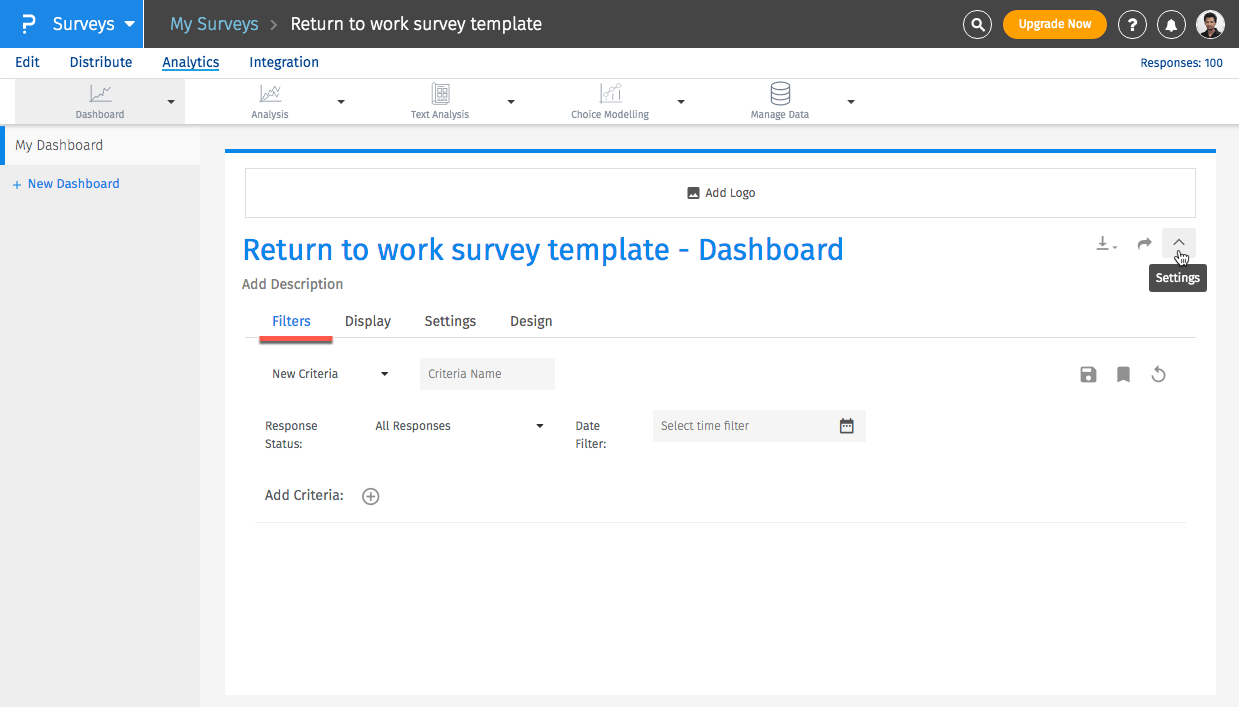
- Filters: By default, the survey status filter is set to all responses. You can add additional filters and the dashboard will be updated in real-time. You can also save frequently used filters to access directly as and when needed.
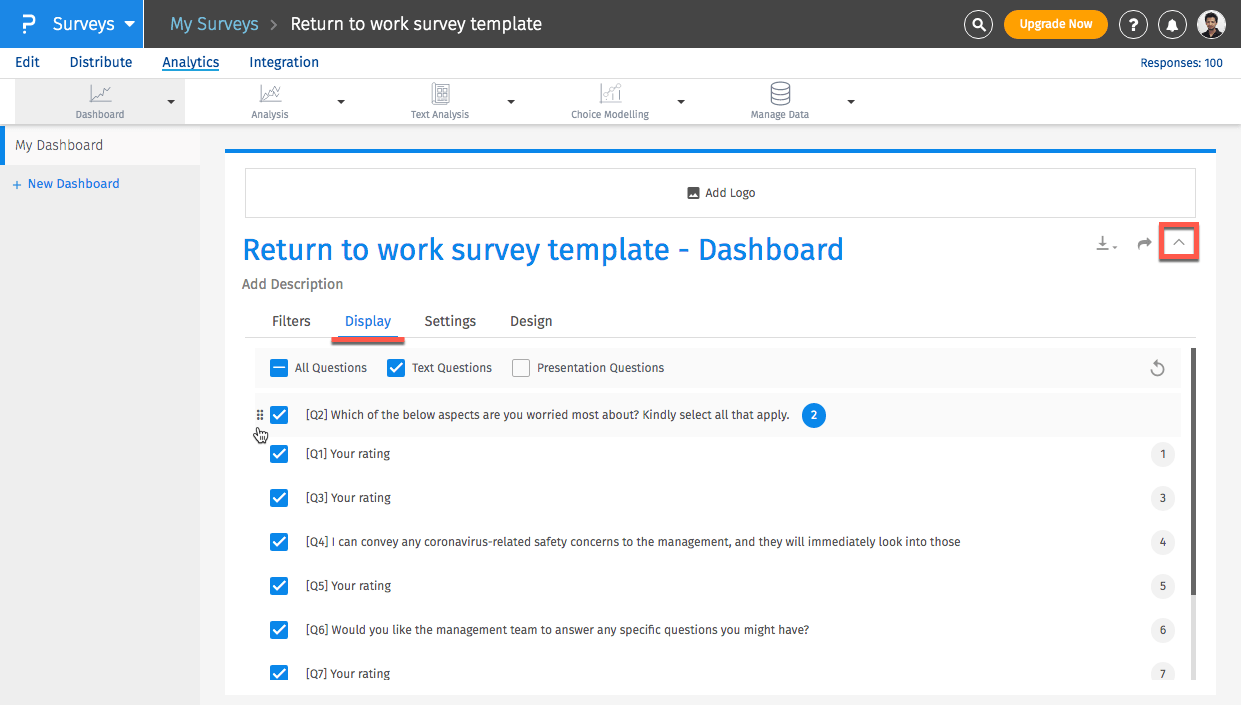
- Display: By default, all questions are shown in the report. You can show or hide and reorder the questions.
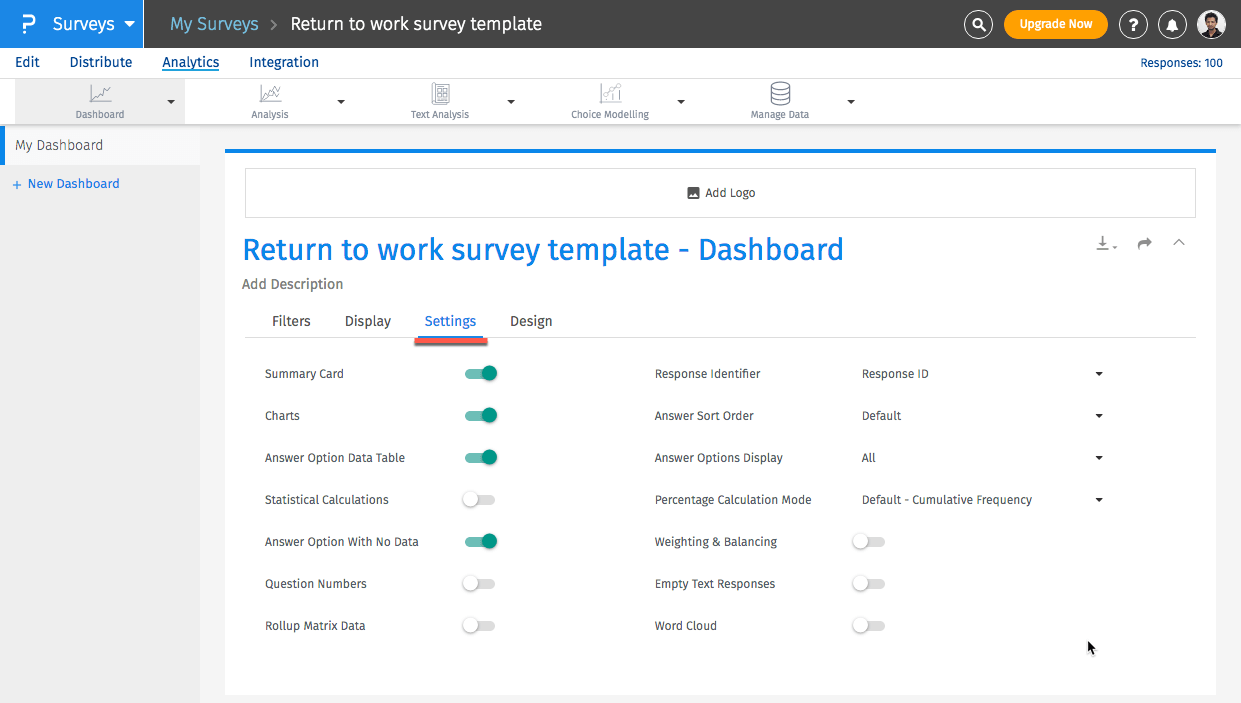
- Settings: Here you can enable or disable settings for the dashboard, like turning off question numbering or changing the response identifer from the response ID to the respondents email address or a custom variable.
- Charts: It displays charts to represent the calculation like bar graph, pie chart etc.
- Answer Options Data Table: It displays the answer options of the question like option1, option2 etc.
- Statistical Calculations: It displays calculation like mean, deviation, standard error etc.
- Answer Options With No Data You can decide to display the question with no data or vice versa.
- Question Number: It displays the question number in the Dashboard report.
- Rollup Matrix Data: This is mostly used for matrix type question. It rolls up the individual report of a matrix question.
- Response identifer: Replace the response ID of the respondent with the email address or a custom variable to identify a response in the dashboard.
- Answer Sort Order: Sort the order of the answer options.
- Answer Options Display: Select the answer options which you wish to display.
- Percentage Calculation Mode: Change the percentage calculation from cumulative frequency to Started, Completed or based on answered questions.
- Weighting and Balancing: Enable Weighting and Balancing.
- Empty Text Responses: Show or hide empty text responses.
- Word Cloud: To display an image composed of words used in a particular text or subject, in which the size of each word indicates its frequency or importance. It will be based on your open ended text data.
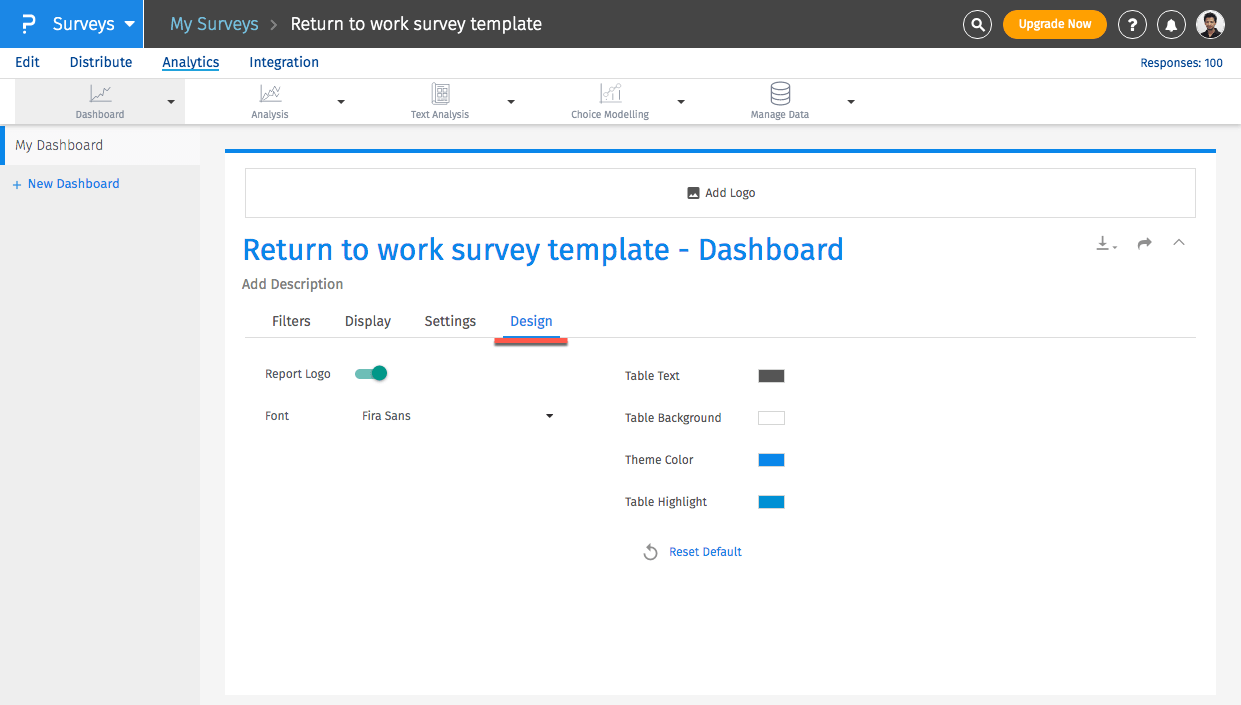
- Design: Here you can customize the theme of the dashboard.
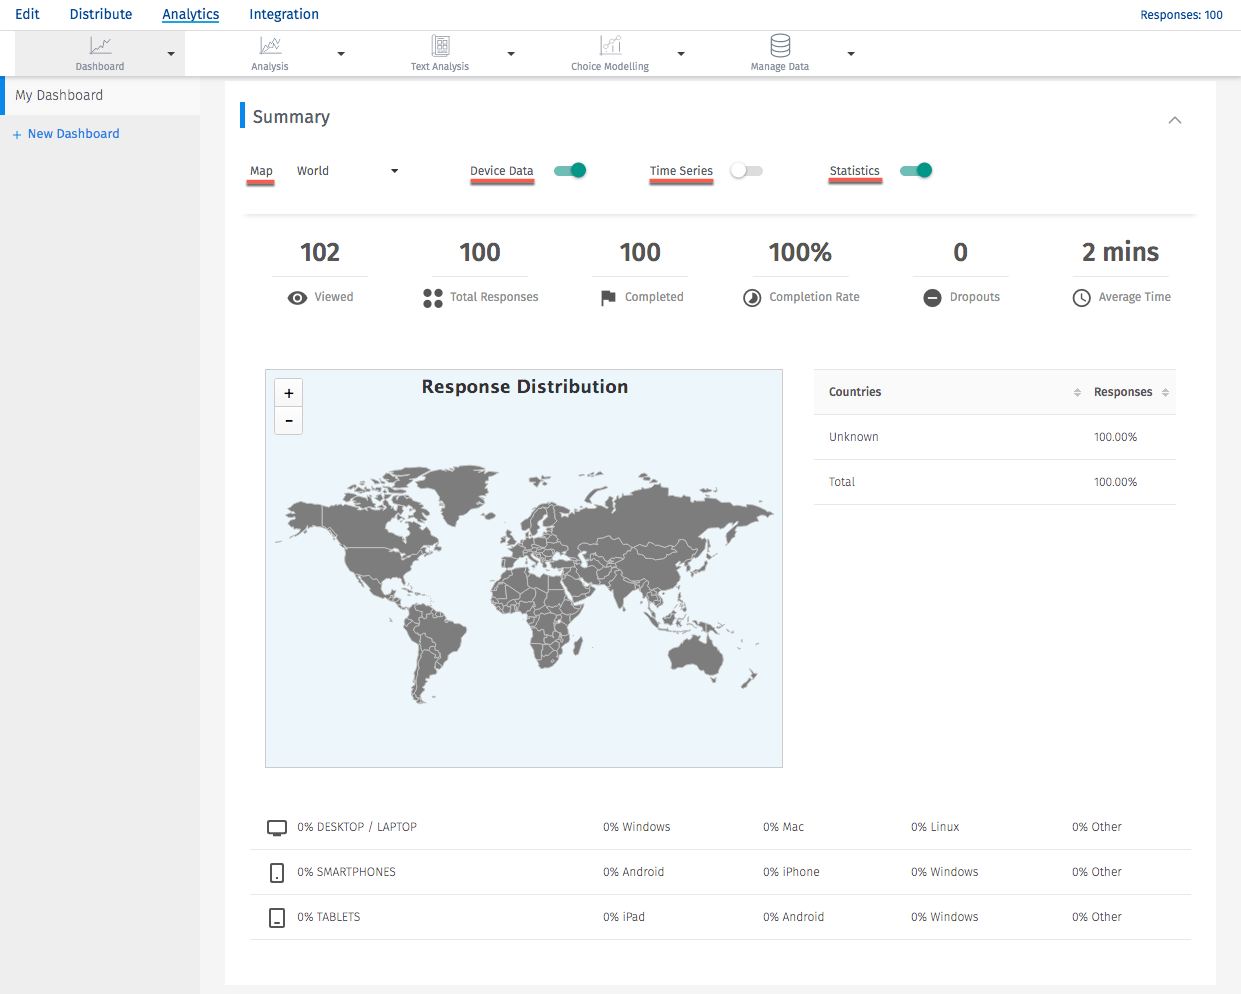
- Map: Select the map you wish to display on the dashboard.
- Device Data: It displays device data, that is with device was used to take the survey.
- Time Series: It will display a chart graph based on the time series of when the response was captured
- Statistic: It displays the overall statistics of the survey that is number of viewed, started, completed, etc.
- Title and Logo: You can update the title for the report as well as add description and also add logo for the dashboard.
- Share Settings: Click on the share icon to open share settings for the dashboard.
To view the summary report settings click on the gear icon:
License
This feature is available with the following licenses :
GET STARTED WITH YOUR FIRST SURVEY NOW
SIGN UP FREEYou may also be interested in...
Dashboard
Sharing reports - Dashboard
Dashboard Filter
Customize Theme - Dashboard